


How to Read Historical Maps Without Taking Them at Face Value

27 min read
A historical map can show where people went, what they valued, and how they imagined a place. It can also hide as much as it reveals. This practical guide explains how to test a map’s date, purpose, scale, projection, symbols, names, boundaries, and omissions before using it as evidence.
Illustration: A magnifying glass highlights details on a fictional historical-style map beside a blank legend, scale bar, and research notebook.
A historical map has a peculiar power. A line, color, or name seems to settle a question at a glance: this was the road; that was the boundary; here was the town. But a map is not the landscape itself. It is a made object that compresses a place into a particular format for a particular audience, at a particular moment. Its apparent authority can make its choices easy to miss.
That doesn’t make maps unreliable. It makes them records that reward careful reading. A map may preserve a surveyor’s measurements, a government’s claim, an insurer’s inventory, a traveler’s route, a publisher’s idea of what readers should know, or several of these at once. It may be exceptionally precise about one subject and silent about another. The central question is not simply, «Is this map accurate?» It is, «Accurate for what purpose, according to whom, and at what scale?»
The method below is useful whether you are studying a family property, a changing neighborhood, a military campaign, a county line, a city’s growth, or a map that fascinates you for its own sake. Begin with the map as an object. Then ask how it represents space, what its categories mean, whose presence it records, and what other evidence can confirm. Read slowly enough to separate what the map visibly says from what you infer from it.
1. Start with the map as an object
Before tracing a river or matching a street to a modern address, establish what you are looking at. Record the full title, the maker or issuing institution, the publisher, the place and date of publication, the map’s physical format, and where you found it. Look beyond the central image. Information may sit in a title cartouche, a marginal note, a printed border, a map collar, an atlas title page, or a catalog record. A map without a visible title may have a supplied catalog title; an undated map may have an estimated date. Those are useful descriptions, but they are not the same thing as words printed on the map.
Archives and libraries are not interchangeable windows onto the past. Their collections have histories, and an institutional catalog tells you how an item was identified and preserved. The Library of Congress’s guide to manuscript maps, for example, distinguishes titles transcribed from a map from titles supplied by catalogers, and distinguishes a date printed on the item from an estimated date. That distinction matters. If the map itself says «surveyed by,» «compiled from,» or «published by,» keep those roles separate rather than treating «the mapmaker» as one person. A surveyor may have gathered measurements, a draftsman may have assembled the image, a publisher may have chosen its title, and an official may have ordered it.
Ask how the map reached its current collection. A government map preserved with the records of the office that made or used it can carry clues about administrative purpose. A commercial map in a publisher’s atlas has a different documentary setting. The National Archives describes its cartographic holdings as records made or accumulated by federal agencies and organized in record groups reflecting where records originated. That origin, or provenance, can help explain what the map was for and which related papers might survive beside it. A map detached from its file may lose precisely the context needed to interpret its markings.
Keep a small «map identity» note before interpretation: exact title; maker and publisher as stated; date as printed or cataloged; scale and projection if given; series or edition; repository and stable item link; and any catalog notes about damage, missing sheets, or uncertain dating. This is not clerical busywork. It protects you from mixing a modern catalog description with the map’s own wording, and it makes the map findable again when a digitized image is shared without its original page.
2. Ask what problem the map was made to solve
A map’s purpose is often the most important clue to its contents. Instead of beginning with the assumption that a map tries to show everything, ask what its first audience needed to do with it. Navigate a ship? Allocate land? Plan a road? Assess fire risk? Make a military decision? Sell a development? Teach geography? Each task rewards a different selection of facts.
Consider fire-insurance maps. The Library of Congress describes the Sanborn series as large-scale maps prepared to help insurance agents judge the fire hazard associated with individual properties. They show such details as the size and shape of buildings, construction materials, building use, streets, and fire-protection features. Their dense symbols and colors make sense once the reader understands that underwriting was the intended use. Today the same sheets can help researchers investigate buildings and urban change, but the original selection of information was shaped by the insurance business. A Sanborn map is highly informative about mapped buildings and risk-related features; it was not designed to be a complete census of neighborhood life.
Purpose affects not only what appears but also how it is classified. A map made for transport may emphasize routes, junctions, distances, and obstacles. A land survey may privilege measured parcels and legally described lines. A tourist map may make landmarks and memorable routes prominent while simplifying ordinary streets. A propaganda map may use color and naming to reinforce a political argument. Even a seemingly plain reference map reflects decisions about which features are important enough to label, which can be generalized, and which can be left out.
Look for clues in the title, subtitle, dedication, preface, imprint, marginal text, legend, scale, and format. A map described as «for the use of» a specific office, company, expedition, or audience announces a practical role. A publisher’s name can connect a map to a commercial series. A decorative cartouche or patriotic emblem may communicate the map’s intended tone as well as its geographic coverage. None of these clues proves that every mark served the announced purpose, but they help set a sensible expectation.
Then ask what the map would have been useful for and what that usefulness would make invisible. An insurer may need building materials and hydrants, not the names of tenants. A land office may need parcel lines, not trails or seasonal uses that do not fit the parcel system. A railroad planner may map a proposed route with great care even if the route was never built. The user’s question should be narrower than «What does the map tell me about the past?» Try: «What information did this map’s makers need to collect, display, or persuade someone to accept?» That question turns a map from a picture into evidence about a working practice.
Also distinguish an intended purpose from an actual use. A map created for one institution may later be annotated, copied, or repurposed by another. Handwritten additions can be later than the printed base. A military map could be used by a local historian; a survey plan could become evidence in a property dispute. If an added line or note matters to your conclusion, examine its handwriting, color, placement, and relation to the printed content. When its date or author is unknown, say so rather than silently assigning it to the original mapmaker.
3. Treat «the date» as a set of dates
Maps often contain more than one meaningful date. The area may have been surveyed in one year, the map compiled or drawn in another, revised later, printed later still, and digitized decades afterward. A date in a catalog may refer to publication, while a date on the map may refer to a survey, revision, or edition. If you use only one number, you may accidentally treat an older base as a fresh observation.
USGS historical topographic maps make this especially easy to see. Their collars can distinguish a date of base compilation or significant revision from an imprint year, field-check year, photo-revision year, or other revision information. The Survey notes that different copies with the same apparent map date may reflect revisions or reprints, and advises researchers to inspect additional dates on the map collar. Those details are a reminder to read the whole margin, not just the largest date or the file name attached to a scan.
For any map, ask three questions: When was the mapped information observed or surveyed? When was this particular edition assembled or revised? When was this copy printed or published? Not every map answers all three. If the information is missing, record the uncertainty. «Published in 1898» does not automatically mean «surveyed in 1898.» Likewise, «revised 1910» may refer to some content, not every feature. A road could be updated while a town boundary or place name remained untouched.
Chronology becomes more consequential when maps are compared. Suppose a street appears on an 1880 sheet but not on one labeled 1890. Before concluding that the street disappeared, check whether the later map covers the same area, uses a comparable scale, belongs to the same series, and is based on a new survey or a reprint. The feature may have been omitted during generalization, the sheet boundary may have moved, or a mapmaker may simply have changed what the series emphasized. A printed date alone cannot settle those possibilities.
Place names and borders also need dates. A name may have been recorded earlier than the map’s publication or retained after it became less common. A line may represent a proposed boundary, a negotiated boundary, a survey, or an administrative convention. When a claim turns on a precise date, look for the underlying document or record series cited by the map. If that source is not available, frame the claim as «the map published in [year] depicts.» rather than «the place was.»
4. Let scale set the limits of your claim
Scale is a ratio between a distance on a map and the corresponding distance on the ground. At 1:24,000, one unit measured on the map represents 24,000 of the same units on the ground. Put another way, one inch on a 1:24,000 map represents 2,000 feet. A map at that scale can show considerably more local detail than a 1:250,000 map, where one inch represents about four miles. «Large scale» means a larger fraction and more detail over a smaller area; «small scale» means a smaller fraction and less detail over a larger area.
This vocabulary can feel backward because the large-scale map covers less land. A helpful mental image is that you are zooming in: individual buildings, field boundaries, and small roads may become visible, while a continent or state no longer fits on the sheet. At a small scale, the cartographer must simplify. A narrow stream may vanish, several closely spaced roads may merge, and a boundary may be drawn as a clean line even where the underlying landscape is complex.
Scale limits what you can infer from absence. If a feature is not drawn on a regional map, that may tell you only that it fell below the map’s level of detail or outside its subject. It does not necessarily show that the feature did not exist. The same caution applies to apparent precision: a sharply printed line is still a line with width, and a historical survey may have measurement limits that the clean engraving conceals. Do not convert a line’s apparent edge on a screen into a more precise historical boundary than the map’s scale and method can support.
Check both the representative fraction and the bar scale, when present. The bar scale is useful if the image has been resized; the printed fraction only works when the page is reproduced at its original size. A scan displayed at 125 percent on a laptop does not preserve its paper measurement. Before measuring a distance, determine whether the digital image has been stretched, cropped, or rescaled. If a map lacks a scale, look for other clues-known distances, graticules, a stated survey method-but be clear that an estimate is not a printed scale.
Scale also shapes what «detail» means. A city plan can document a block pattern yet omit the wider regional system that connected the city to nearby communities. A county map can show broad roads and named settlements but not the exact footprint of a house. A building plan may locate doors and walls with care but tell you little about the area’s social geography. Match the map’s scale to your question before treating it as a suitable source.
5. Ask what the projection makes easier to see
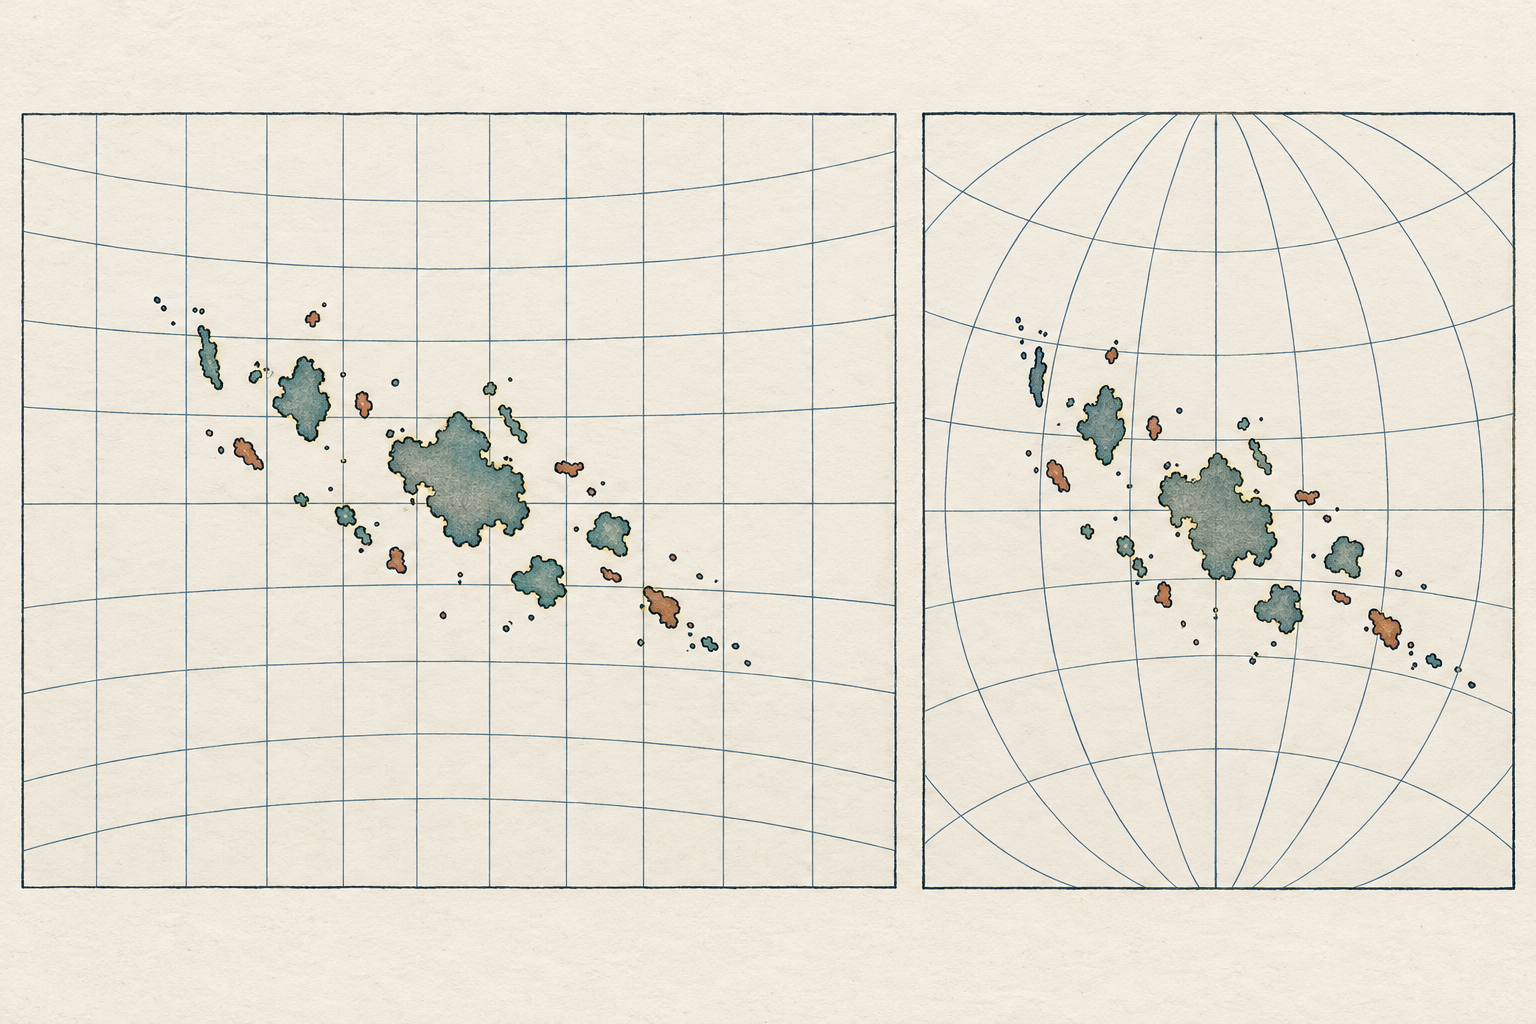
Every flat map of the round Earth involves distortion. A projection is the method used to translate a curved surface onto a flat page or screen. No projection can preserve all properties at once: direction, distance, area, and shape cannot all remain true everywhere on the same flat map. Different projections prioritize different qualities and suit different purposes. The important question is not whether a map is distorted-it is-but what the chosen projection preserves, where its distortions increase, and whether it is appropriate for the task.
The USGS explains that the basic Mercator projection preserves true direction for straight lines within the map’s bounds, a property useful for navigation, while greatly exaggerating areas near the poles. That makes a world map on Mercator a poor tool for comparing the relative area of countries at different latitudes. The same projection can be well suited to a navigation problem. A map’s visual effect may be striking, but you need its purpose and projection to tell whether that effect is a side effect, a useful trade-off, or a deliberate choice.
One example is John Melish’s 1820 map titled The world on Mercator’s projection, cataloged by the Library of Congress. Its title makes a cartographic choice explicit. The record also notes a scale and identifies named contributors, information that lets a reader begin to evaluate the map as a designed work rather than an anonymous image of the world. A title like this is a prompt: what did a Mercator layout make legible to the map’s intended viewers, and what comparisons would it make misleading?
Projection can affect judgments about size, distance, and centrality. A landmass nearer the edge of a world map may appear stretched; two places that look close together may not be close by a route that matters. A map centered on one ocean or capital makes that center visually prominent. North is often at the top, but it is not a law of nature: some maps are rotated to align with a route, coast, or page. Read the compass rose, meridians, graticule, and orientation note if available. If these are absent, use neighboring geography cautiously.
Historical maps may not name a projection, and the projection may be difficult to infer from the image alone. That is a legitimate limitation, not a reason to guess. Use catalog metadata, map notes, or a scholarly catalog record if available. If you cannot identify the projection, avoid making precise area or distance comparisons from the map. You can still study its relative placement and labeling, while noting that its geometry is uncertain.
Projection also matters when you compare a historical paper map with a modern web map. The Library of Congress describes georeferencing as adding spatial reference information to a scanned map so it can be aligned with contemporary data through matched control points. That alignment is an analytical operation, not a hidden truth revealed by a computer: it reflects the reference layer and points chosen by the researcher. Keep the original image in view and treat any overlay as a model.
6. Read the legend as a historical vocabulary
A legend is a key to a map’s symbols, but it is also a record of the categories the mapmaker chose to recognize. The same color or mark can mean different things on different maps. Even within one series, symbol systems can change over time. The safest rule is simple: do not import a legend from a modern map, or from another edition, until you have checked that it belongs to the sheet in front of you.
The Library of Congress advises readers of Sanborn maps to consult the keys and legends in the atlas or on the first sheet. The company’s symbols were standardized enough that they can often be read with confidence, but the Library also notes that symbols, abbreviations, and annotations changed and varied in application. A map’s color is not self-explanatory. In a Sanborn edition, colors could distinguish construction materials, while patterns and abbreviations add other information. That system was meaningful within the company’s own mapping practice; it should not be assumed to work identically on a different publisher’s insurance map.
Pay attention to language as well as graphics. Abbreviations may be technical shorthand, local usage, or a publisher’s house style. A word that seems ordinary today may have had a specific administrative or engineering meaning then. A broad category such as «improved,» «cultivated,» «swamp,» or «waste» may encode a perspective and a purpose; it is not a neutral description of how residents understood the place. Transcribe the map’s term faithfully when it matters, then explain whose category it was and what the map seems to use it for.
Color reproduction introduces another caution. An original may have been hand colored; a digital scan can shift hues; a black-and-white reproduction may erase distinctions that were meaningful on the page. A faint blue line might be difficult to distinguish from a gray one in a low-quality scan. When color is evidence, inspect the highest-quality image you can access and verify whether the item was colored by hand or printed. If you only have a monochrome copy, do not infer a color-coded category from it.
Modern maps offer a useful comparison because they make their own symbol systems explicit. USGS topographic conventions, for instance, have evolved, and the Survey says there is no single symbol sheet that covers every USGS map since the series began. Older sheets may need older instructions. That is a good reminder for all map collections: the legend is not a universal dictionary. It is a dated contract between mapmaker and user. Find the relevant version, read it as carefully as you read the map, and keep the vocabulary attached to that specific source.
7. Notice who and what receives a name
Names are not decoration. A label can preserve a language, indicate whose authority the map recognizes, point to a settlement or route, or replace one way of knowing a place with another. A named feature has become legible to the map’s author and audience; an unnamed one may still have been known, used, or governed by people whose knowledge the map did not record.
The Library of Congress’s guide to Native American cartographic resources makes this point through a broad collection of maps. Many were not made specifically to describe Indigenous environments, yet they can preserve village locations, place names, routes, and other cultural information. The guide also notes a change over time: as Euro-American settlement advanced, maps often replaced earlier Indigenous cultural data with depictions of non-Indigenous occupancy. Read that as a statement about the maps and their changing content, not as evidence that Indigenous communities disappeared when their names ceased to appear.
A single sheet can contain multiple layers of knowledge. The LOC guide describes a 1607 chart by Samuel de Champlain as locating French and Indigenous settlements, with Indigenous places named from observations and interviews with Native people along the North Atlantic coast. That description invites two questions at once. What geographic knowledge did Indigenous interlocutors contribute? And how did a French explorer and a European mapmaking tradition select, spell, arrange, and publish that knowledge for another audience? The map can preserve information while also translating it through a particular author’s framework.
Read every name in context. Is it printed in the map’s original language, translated, transliterated, or later added? Does a label refer to a community, a territory, a river, a route, or a point on an outsider’s map? Is the spelling consistent across editions? Does the title reveal an official or commercial purpose? A name’s presence does not by itself show that the people named accepted the map’s boundaries or the authority implied by its categories. A name’s absence does not prove nobody lived there.
When appropriate, pair archival maps with place-name resources and contemporary records produced by the people or institutions represented. Indigenous naming is not only historical data; present-day tribal nations, communities, language programs, and archives may hold knowledge not captured in the map’s source institution. Respect current preferred names and avoid treating a historical map as the sole authority on a living place. If your research cannot consult those sources, be explicit that the map documents a particular record-maker’s representation rather than a complete account of local knowledge.
8. Treat lines and boundaries as claims to investigate
Boundaries look precise because they are drawn as lines. Yet a line can represent many different things: a surveyed parcel, a proposed road, a treaty boundary, a county limit, a military front, a jurisdiction, a reservation, a concession, or a generalized edge used for graphic clarity. Some lines were negotiated; others were imposed, contested, or never implemented. A map may show a claim without proving that it was accepted by everyone concerned or enforced on the ground.
Start by reading the map’s labels and legend. Words such as «proposed,» «approximate,» «surveyed,» or «claimed» change the status of a line. A boundary represented by color shading may be a thematic classification rather than a legal border. A neat line could be copied from an earlier map rather than measured afresh. Ask who had authority to draw it, which records governed it, and whether the line was meant to describe conditions, prescribe a plan, or persuade a reader that an arrangement was settled.
In the United States, the National Archives’ guide to Bureau of Land Management and General Land Office records identifies series containing maps of American Indian reservations and land cessions, as well as field notes related to boundaries. Those holdings make a practical point: a boundary map is strongest when read alongside the records and administrative process that produced it. The map may point you toward the relevant treaty, survey, correspondence, or land file. It cannot replace those materials when your question depends on what was agreed, enforced, or disputed.
Color can make a political claim seem self-evident. A shaded territory may be presented as a stable unit even if control was uneven or contested. A boundary may erase overlapping or seasonal uses that do not fit a single closed polygon. This is not an argument to reject all mapped boundaries. It is a reason to avoid converting the map’s graphic certainty into an unsupported statement about lived reality. Describe what the map depicts, identify the institution or author responsible, and then check what separate documents say about how the line came to be.
For a modern reader, the word «territory» can sound like a fixed, bounded space. In historical sources it may refer to a government jurisdiction, a claimed region, a negotiated area, or a title imposed by an outside institution. Preserve the map’s original terms in quotation marks when necessary, explain them in their historical context, and avoid implying that one map settles a legal or political question by itself. The map is a source in a record of claims; it is rarely the whole record.
9. Study omissions without turning absence into proof
Every map leaves things out. A sheet has limited room; symbols compete for attention; a mapmaker simplifies lines and selects features according to scale and purpose. A road may be too small to draw, a neighborhood may fall outside the mapped coverage, and a land use may not fit the map’s categories. These are ordinary limits of representation. They become especially important when someone reasons from silence: «The map does not show a settlement, therefore no one lived there.» That conclusion usually asks more of the map than it can carry.
There are different kinds of absence. A feature may not have been observed, may not have been reported to the mapmaker, may have been deliberately excluded, may have been generalized away, or may be hidden in a damaged or incomplete scan. The map might also use a category that makes a feature difficult to recognize. These possibilities have different meanings, and the sheet alone may not let you choose among them.
Try to turn absence into a research question. If a community is missing, what was the map’s purpose, who commissioned it, what scale was used, and which companion records might name the community? If a road is absent, do other maps or travel accounts show it? If a parcel is blank, does the blank mean «not surveyed,» «not mapped,» «outside jurisdiction,» or something else? A map’s blank spaces can be suggestive, but they are not self-interpreting.
Some omissions are systematic enough to become evidence when compared across a series. If the same type of feature repeatedly disappears as the map’s audience or institutional context changes, that pattern may reveal a shift in what the mapmaker considered relevant. The Library of Congress’s discussion of Indigenous cartographic resources, for example, describes how cultural data on some maps gave way to depictions of non-Indigenous occupancy over time. That is an observation about a pattern in map content. To explain the causes or consequences of the change, researchers need additional sources and careful historical argument.
Do not assume every omission was deliberate erasure, either. Sometimes a line or label is missing because of scale, sheet coverage, an incomplete edition, printing damage, or a cataloging gap. «The map leaves this feature out» is an observation. «The mapmaker excluded it to deny its existence» is an explanation that needs evidence about intention and context. A critical reading is rigorous precisely because it keeps those two statements separate.
A practical test is to write down three columns in your notes: what is visibly present; what is visibly absent; and what additional source could distinguish between plausible explanations. The first column belongs to the map. The second is a feature of your observation, not automatically a fact about the past. The third keeps the investigation open. Census records, deeds, survey notes, newspaper accounts, oral histories, photographs, and maps made by different communities can help answer different questions, though each also has its own limits.
10. Compare maps carefully, not mechanically
Comparison is one of the best ways to learn from historical maps. A sequence can show that a road, shoreline, neighborhood, or political boundary was represented differently over time. But comparison can also create false certainty if the sheets are not comparable. Before describing a change, align the maps’ coverage, scale, projection, orientation, subject, date, and edition. If several of those differ, the difference you see may be cartographic rather than historical.
Compare like with like where possible: the same map series, similar scale, adjacent editions, or maps made for the same function. If that is not possible, name the mismatch. A regional map from one decade and a city plan from another might still be useful together, but they answer different questions. Avoid saying that one «proves» the other wrong unless you have established that they depict the same place, time, and kind of information.
Map series can carry their own traps. A new edition may redraw sheet boundaries, renumber pages, or update only part of the content. The Library of Congress notes that Sanborn sheets were sometimes completely redrawn and renumbered from one edition to the next. A researcher who compares two images without checking the atlas index could mistake a changed page layout for a changed city. The index, title page, and neighboring sheets are part of the evidence, not administrative clutter.
When comparing maps digitally, remember that the software is adding decisions of its own. An overlay requires choices about matching points, warping images, and dealing with different projections and scales. A close fit along one street may pull another part of the old map out of alignment. If an overlay helps you inspect change, preserve the unaltered images and record how they were aligned. Label the output as an interpretation, not as the original map.
Look for both continuity and change. If a road remains on three maps, that is useful, but it does not prove that its route or condition remained identical. If a label shifts, it might reflect an actual move, a new spelling, or a cartographer’s choice. A sequence can reveal when a change first appears in the surviving maps, which is not always the date when the change occurred. Put a range around the event when your source trail supports only a range.
It is also useful to compare maps from different makers or communities, not just successive editions of one official series. Agreement between maps can strengthen a claim, but shared sources can create shared errors. Two publishers may have copied the same earlier map. Divergence can be just as informative: it may reveal different audiences, aims, information networks, or definitions of a place. Explain why the maps might differ before treating one as more trustworthy.
11. A worked method: investigating one city block
Imagine you are curious about a particular city block in 1900. Did it contain homes, workshops, shops, or open lots? A fire-insurance atlas may be a good starting point because its purpose led its makers to record building footprints and construction-related detail. But you still need a disciplined workflow before drawing conclusions about the neighborhood.
First, identify the correct map coverage. A city may have multiple volumes and sheets, and the coverage boundaries can shift between editions. Use the collection’s search or volume-finder tools, then check the atlas index or key map to locate the block. Do not assume that the first search result covers your address or that a map page depicts the entire city. Record the city, edition date, volume, sheet number, and item link.
Second, read the preliminaries. Find the title page, legend, index, and any notes about fire protection or mapping conventions. The LOC Sanborn guide explains that the nature of prefatory material varied by town and over time; a key map can help identify which sheet covers which part of the city. Those pages can tell you how the company framed its work and how to interpret the sheet, and sometimes they offer useful context about the city’s services or layout.
Third, make a literal description before making an argument. Note the street names, block numbers, building footprints, labels, colors, and symbols exactly as shown. If one building is marked as a store or dwelling, record the map’s abbreviation and how you decoded it. If you cannot resolve a symbol, flag it. Keep observations separate from deductions such as «this was a prosperous block» or «these residents were working-class.» The latter claims require evidence the map may not provide.
Fourth, compare editions and neighboring sheets. A later atlas may show an altered footprint, a new street, or a changed building use. Check the title and revision notes to learn what the edition dates mean. Examine adjoining sheets for buildings or context that continue across the boundary. The LOC collection’s guidance warns that keys can vary and that Sanborn sheets may be redrawn or renumbered. These are reasons to compare the atlas as a set rather than isolated squares of color.
Fifth, add independent records that answer different parts of the question. City directories can help identify businesses or occupants by address. Census schedules may provide household information, with the caveat that they reflect the categories and coverage of that census. Deeds and tax records may clarify ownership, while photographs or newspapers may provide a view of a building or event. A fire-insurance map, directory, and photograph each document a different slice of the block; they should not be forced into a single source’s perspective.
Finally, phrase the conclusion at the level the evidence supports. A cautious statement might be: «The 1901 Sanborn sheet depicts three masonry commercial buildings on the block’s north side and a row of frame dwellings on the south side; the map’s legend identifies the colors as construction materials.» That is a claim about what the map depicts. If directories identify a named grocer at a storefront, you can add that with a citation to the directory. You cannot infer from the map alone who lived in every dwelling, how residents experienced the block, whether every building was occupied, or whether a classification captures the community’s own understanding of place.
12. Make claims that show their evidence
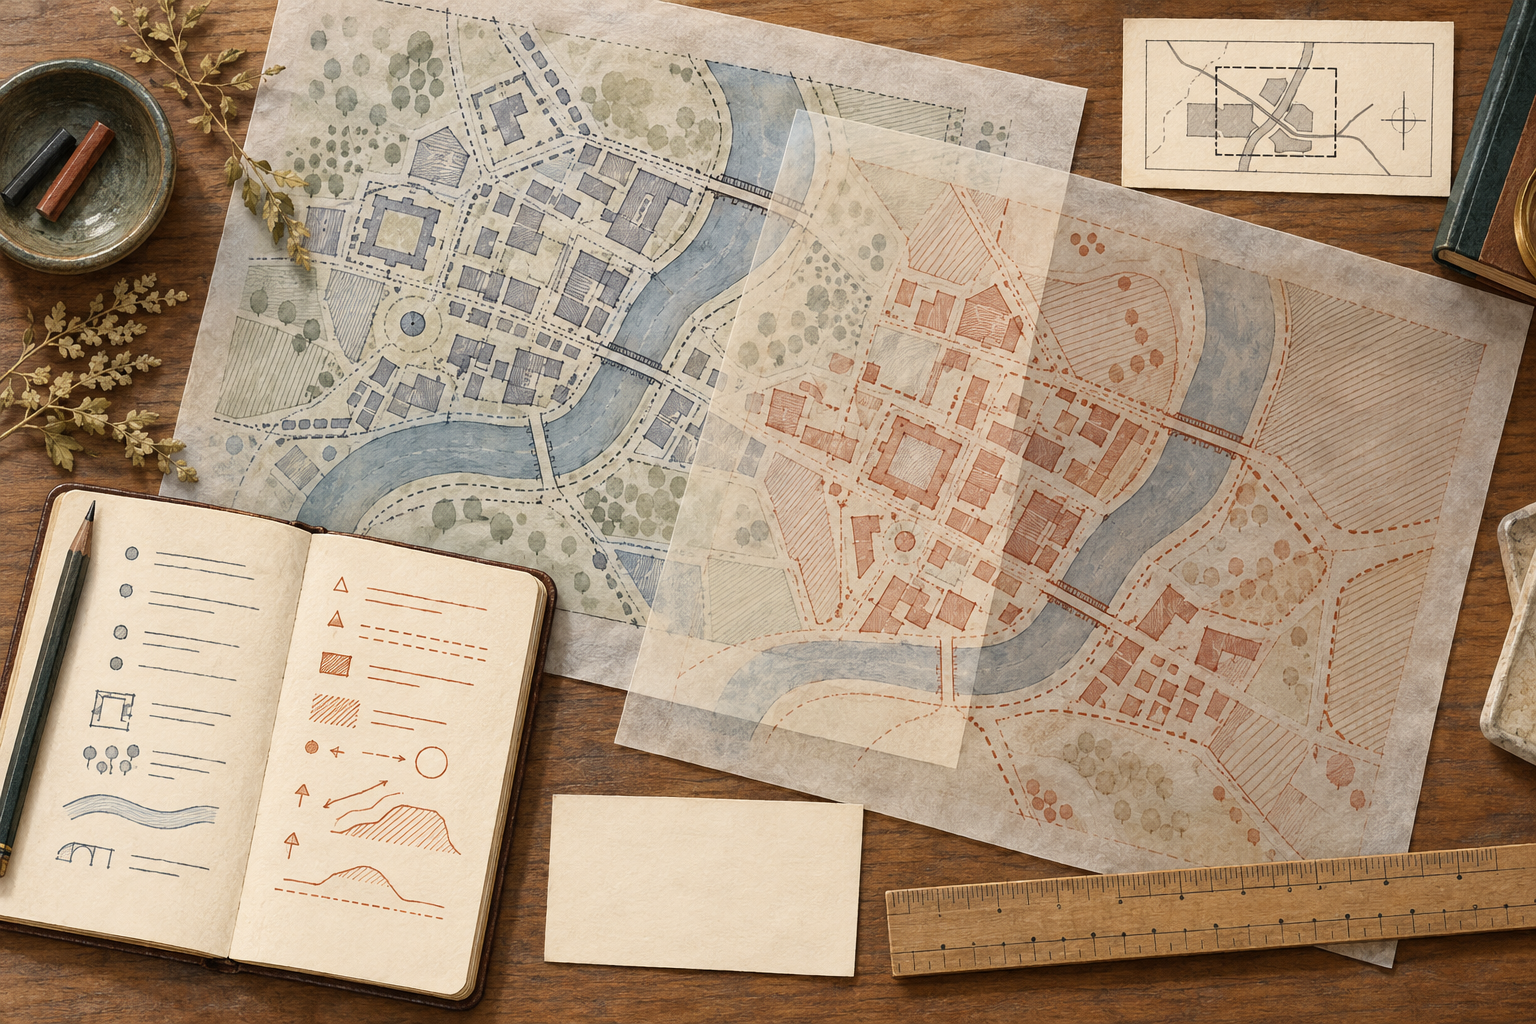
Try a sentence pattern like this: «On the [edition or date] map, [feature] is shown as [symbol or label]. Because the map was made for [purpose] and uses [scale or category], this supports the limited inference that [claim]. It does not establish [specific unknown], so I compared it with [other source].» You do not need to write every paragraph in that formula, but the structure reveals where an argument is missing a step.
When citing a map, identify the author or responsible creator when known, its title, format, publication details or date, repository, collection, and a stable URL. The Library of Congress’s guide for citing maps and charts provides a model that includes creator, title, format, publication information, repository, collection, and link. Add the sheet, volume, or identifier when the map is part of a set. If you use a digitized image, cite the item record rather than only a cropped image URL. That lets readers inspect the context you relied on.
Quote the map’s own labels accurately, including outdated or offensive wording when it is essential to the analysis, but make clear that the label belongs to the historical source. Do not silently modernize a spelling or adopt a map’s term as your own description. Where names or political claims are contested, explain whose wording you are using and seek additional sources. The point is not to make every map carry a disclaimer; it is to prevent the mapmaker’s categories from disappearing into your prose as if they were facts without authors.
Finally, preserve uncertainty when the map is incomplete, damaged, undated, poorly scanned, or detached from its title sheet. Say what is unknown, what you checked, and what remains open. A precise boundary, a vivid color, or a confident label can feel conclusive, but evidence becomes more trustworthy when its limits are visible.
Conclusion: Read the map, then read its choices
Historical maps are among the most useful records for thinking spatially about the past, but their clarity can be deceptive. They simplify a world into a page. Their dates may refer to different stages of production; their scale controls what can be seen; their projections trade one kind of accuracy for another; their symbols and names reflect a particular vocabulary; and their boundaries and omissions belong to a history of decisions.
A critical reader does not dismiss the map or treat it as neutral. Instead, identify the object, investigate its purpose, read its marginalia and legend, check its scale and projection, notice which names and lines carry authority, and compare the map with other editions and records. Then state what the map can support, what it cannot establish, and why. A map read that way offers more than a picture of where things were. It becomes evidence about how people measured, organized, imagined, used, and contested space.