


Chesapeake’s New Restoration Grants Put Local Streams in Focus
ONELROR • ENVIRONMENT
Chesapeake’s New Restoration Grants Put Local Streams in Focus
A guide to the streams, practices, maintenance and evidence behind the watershed’s October funding announcement.
By OnelROR Editorial Team · Published October 3, 2026 · Updated October 7, 2026 · 27 min read
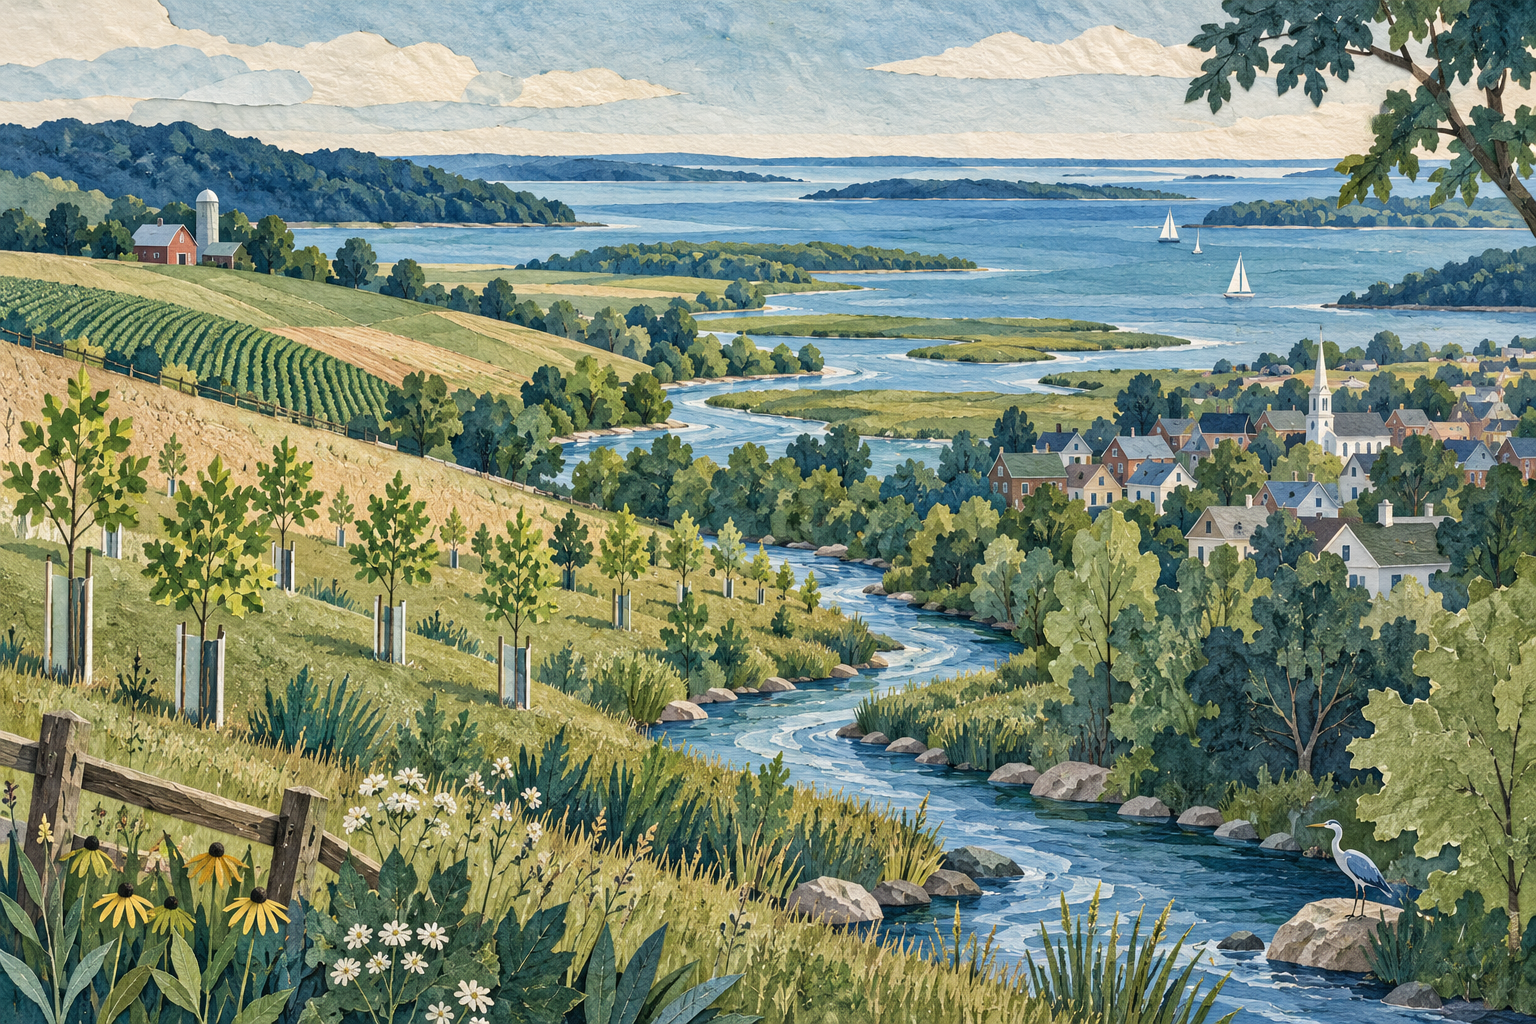
Featured image: original AI-generated editorial illustration, not a photograph of an awarded project.
An October 2 funding announcement for the Chesapeake Bay watershed is an invitation to look closely at the streams, drainage areas and local organizations behind a regional headline. Money can make restoration possible, but an award is the beginning of a delivery process. The useful next questions concern where work will happen, what it is intended to change and how residents will know whether that change occurred. This expanded guide retains the original announcement while explaining how to follow a project from its grant description to its later evidence.
At an event in Smithfield, Virginia, the Environmental Protection Agency announced more than $90 million for 83 watershed projects: $37 million from EPA and an additional $53 million from other agencies. The grants are associated with the Small Watershed Grants and Innovative Nutrient and Sediment Reduction programs under the Chesapeake Bay Stewardship Fund. This article does not report newly completed restoration or invent findings from projects that have only been announced. It uses official grant information, scientific background and clearly identified hypothetical examples to make the investment easier to understand.
Read the funding headline before adding numbers
The EPA announcement supplies the regional funding framework. The National Fish and Wildlife Foundation’s 2026 nutrient and sediment reduction slate describes a particular program within that wider story: 16 awards totaling $15.6 million, with $32 million in matching contributions. The two documents have different scopes. Do not add the slate’s total to the EPA headline as though they describe two unrelated announcements. Before combining any figures, identify the program, the accounting category and whether a contribution is already included in another total. A larger sum produced by double counting is not a more complete picture.
A hypothetical budget illustrates the issue without claiming anything about an actual grantee. Suppose a project receives a $100,000 grant and identifies $50,000 in matching support. Its described resources total $150,000. If a regional announcement already includes that project’s full resources, adding another $150,000 would count them twice. If it includes only the grant award, the matching support is a different category that must be labeled. The arithmetic is easy; the difficulty is knowing what the original total measures. Accurate reporting begins with that definition, not with addition.
Matching support also deserves a precise description. A reader should ask whether it is cash, services, another award or some combination permitted by the program. This guide does not assume the composition of any particular match beyond what the official document states. Nor does a budget tell you when resources will be spent. An award amount, a project budget, a payment and an expenditure record describe different stages. Keeping those labels separate lets a resident follow progress without confusing a planned contribution with money already used for completed work.
Two local examples make the slate tangible
The NFWF slate includes a $1 million Cumberland County, Pennsylvania, award with planned restoration of 25 acres of streamside forest buffers and runoff treatment across 300 acres of developed land. A separate $1 million award for Watts Branch in Washington, D.C., combines nature-based stormwater work, correction of residential sewer connections and community partnerships. These descriptions are plans, not measured outcomes. Their value here is showing that a watershed investment can take different forms: a landscape practice in one place, drainage and connection work in another, and coordination supporting both.
The contrast suggests a useful way to read a project summary. Identify the local waterway, the problem being addressed and the proposed mechanism. A buffer project asks how land beside a stream will function. A sewer-connection project asks whether a pipe carries water to the intended system. A community partnership asks who will participate and keep the effort organized. These are related tasks, but one cannot substitute for another. A planting count does not establish that a connection was corrected, and a meeting count does not establish that a stream improved.
For residents near either example, the next step is to find implementation information from the responsible organization when it becomes available. The grant slate provides a starting point rather than a full construction calendar. Ask which specific sites are included, which decisions remain to be made and how updates will be published. Do not assume every stream in a county is part of the award because the county’s name appears in the title. The geography of a grantee can be much broader than the catchments where the work is actually planned.
A watershed is a connected area, not just the bay shore
A practical way to think about a watershed is to follow the route water takes from land into connected drainage channels. A local stream matters because it is part of a larger network. A project far from a tidal shoreline can therefore belong in a Chesapeake restoration story. The location of the final receiving water does not mean all the relevant work occurs beside it. This is an explanation of the connection between upstream places and downstream goals, not a claim that one particular installation will produce a detectable change everywhere in the bay.
For an original mapping exercise, begin with a named local waterway and locate its tributaries using a reliable public map. Record where the proposed project sits relative to that waterway. Then identify the receiving stream and larger river described in the project materials. A simple diagram of that sequence can be more informative than a photograph of open water. Keep unknown connections marked as unknown. A drain visible beside a road does not reveal its entire route, and a map should not be filled in with guesses merely to make the diagram look complete.
The watershed perspective changes how a resident reads scale. A small intervention may be designed to address a local problem within a larger coordinated program. Its importance is not determined only by whether it occupies a dramatic site. Conversely, being part of a large watershed does not automatically make a small project effective. The explanation needs a pathway: which water is intercepted, which pollutant or flow problem is targeted and where the benefit is expected. That pathway is the bridge between a local activity and a regional restoration goal.
Nutrients are necessary; excess is the problem
EPA’s nutrient-pollution overview explains that nitrogen and phosphorus belong naturally in aquatic ecosystems, but excessive inputs can stimulate algal growth and reduce the oxygen available to aquatic life. The distinction is important. Restoration does not seek a waterway with no nutrients at all. It seeks conditions that support the intended ecosystem and water-quality goals. When a project refers to nutrient reduction, ask which nutrient it targets, where that nutrient comes from and what measure will be used to describe progress. “Cleaner” is an aspiration until the relevant variable is identified.
An educational analogy can make this easier without pretending to be a scientific model. A household budget needs income, but an uncontrolled inflow into the wrong account can still create a problem. Similarly, the presence of a substance and the excess of that substance are different questions. The analogy is limited: aquatic ecosystems are not bank accounts, and their responses depend on interacting conditions. Its purpose is simply to prevent the mistaken idea that a nutrient-reduction project treats all nitrogen or phosphorus as inherently foreign to the natural world.
A grant description can identify the intended reduction without proving the amount ultimately achieved. That is why readers should preserve the verbs in the source. “Will implement,” “is expected to reduce” and “measured a reduction” describe different levels of evidence. A projected benefit can be a reasonable basis for choosing an intervention, but it should remain a projection until assessed. This does not make planning worthless. It gives planning its proper role and leaves room for monitoring to test whether the expected pathway worked in the place where it was applied.
Sediment and clarity are related but not interchangeable
The USGS explanation of turbidity describes a measure of how suspended material affects the clarity of water. A waterway’s appearance can offer a reason to investigate, but a photograph cannot establish the concentration of every pollutant or the full ecological condition. Muddy-looking water and nutrient pollution are not identical observations. A resident following a restoration project should avoid using a single visual impression as a universal water-quality score. Ask which measurement the project uses and what that measurement can legitimately support before deciding that a change in appearance proves success or failure.
In a hypothetical photo pair, the first image shows a stream soon after rainfall and the second shows it during a dry spell. The second looks clearer. That difference could reflect the different conditions when the images were taken rather than an improvement caused by a nearby installation. The images can still document the site, but they are not a controlled comparison. A more informative caption would state the date and conditions of each photograph and distinguish visible appearance from any laboratory or instrument reading collected at the same time.
The practical lesson is to give each kind of evidence a suitable job. A photograph can show construction progress, a blocked inlet or the condition of a planted area. A measured reading can describe a particular variable at a particular time and place. A longer series can help reveal a pattern. None of those tools automatically answers every question. A clear public update explains which tool was used, what it observed and what remains outside its scope. That is more credible than presenting an attractive image as a complete evaluation.
Dissolved oxygen is a condition with several influences
EPA’s dissolved-oxygen guidance describes links among nutrient enrichment, plant growth, respiration, decomposition, temperature and oxygen availability. This helps explain why a nutrient intervention and an oxygen observation do not have a simple one-to-one relationship. The environment contains interacting processes. For a resident, the useful response is not to attempt a diagnosis from one reading. It is to ask how the project’s monitoring plan accounts for the conditions under which a reading was taken and whether the evidence supports the particular conclusion being communicated.
Imagine an invented report that compares a morning oxygen reading with an afternoon reading collected weeks later. Even if the numbers differ, the report needs context before attributing the difference to restoration. The time, location and relevant conditions can affect interpretation. This example does not prescribe a monitoring design or establish which factor dominates a real stream. It illustrates why a public statement should disclose the comparison being made. The more specific the causal claim, the more carefully its supporting observations need to be matched to that claim.
Readers do not need to become water chemists to ask good questions. They can ask which variable was measured, whether the method stayed consistent and who interpreted the results. They can also distinguish a technical uncertainty from a missing document. A project may have a valid monitoring approach that has not yet been summarized for the public; that calls for clearer communication. Or it may have an unresolved design question that requires specialist work. Treating both situations as the same kind of failure would obscure what needs to happen next.
A stormwater practice has a route through it
EPA’s green-infrastructure descriptions explain how practices such as rain gardens, bioretention areas and vegetated swales collect or manage runoff. For an observer, the essential idea is a route: water approaches, enters a practice and then leaves or is retained through the processes intended by the design. A planted depression is not simply a flower bed with an environmental label. Its connection to a contributing drainage area matters. The article does not provide engineering instructions or assume that a particular practice is suitable for a homeowner’s property.
For a hypothetical public site, sketch the route with three labeled boxes: source area, treatment area and receiving route. Then add the questions that are still unanswered. Does the project material identify the source area? Is the inlet visible from a permitted public viewpoint? Does the organization describe what happens during larger storms? The sketch is a way to organize information, not a design certification. If the route cannot be established from public materials, the correct note is that the information is missing, rather than a guessed arrow across the map.
This approach helps distinguish area treated from area occupied. A small installation may receive runoff from a larger paved surface. A planted area’s physical footprint and the drainage area contributing to it therefore answer different questions. A project update should label both when it uses them. Without that distinction, a resident may incorrectly believe that the entire contributing acreage has been converted into a garden. Clear terminology allows an intervention to be assessed on its intended function instead of on an imagined change that the project never promised.
Streamside planting begins a longer timeline
The Cumberland example includes forest-buffer restoration, which makes the land beside a stream part of the project. A resident can follow that work without pretending that the day of planting is the end of restoration. The important public questions concern establishment, care and the conditions the planting is intended to support. What was planted, who is responsible for checking it and what happens if parts of the installation do not establish as planned? Those questions refer to the proposed work’s continued existence, not merely its appearance in an announcement photograph.
A hypothetical planting report might list 100 planted trees. A later inspection might find 80 still present and a plan to replace the missing 20. Those invented numbers illustrate three different records: initial installation, later condition and corrective work. Reporting only the first number would omit useful information; reporting only the missing trees might omit the response. A balanced update can describe all three without turning normal maintenance into either automatic success or automatic scandal. The public needs to understand what changed and what the responsible team is doing about it.
Avoid judging a buffer solely by whether it looks like a mature forest immediately. That expectation confuses an installation milestone with a longer development process. At the same time, patience should not mean abandoning oversight. The team can identify observable near-term milestones and the later questions those milestones support. Residents can follow those distinctions in the published plan. The purpose is to connect the timeline to the intended function, so that an early photograph is neither dismissed for lacking mature trees nor exaggerated into proof of a finished ecosystem.
Correcting a connection is different from landscaping
Watts Branch’s slate description includes correction of residential sewer connections as well as nature-based stormwater practices. That combination matters because different problems may need different mechanisms. A project involving pipes cannot be evaluated solely through the survival of plants, and a planting program cannot be assumed to correct a wrong connection. A useful update should identify the separate workstreams and their completion criteria. The original grant description supports the existence of those planned activities; it does not establish how many corrections have been completed or what later measurements will show.
For an invented neighborhood project, a dashboard could keep separate fields for drainage installations, connection investigations, verified corrections and public outreach. That arrangement prevents one type of activity from hiding the status of another. If investigations are complete but corrections are pending, the update can state that precisely. If a planted installation is finished while a pipe task remains unresolved, the whole project should not be presented as uniformly complete. The dashboard example is an editorial suggestion, not a claim that the actual Watts Branch grantee uses that reporting system.
Residents should direct connection questions to the appropriate project organization or utility rather than attempt to investigate underground infrastructure themselves. Public participation is valuable when it helps responsible teams identify concerns and communicate plans. It does not require entering work areas, opening infrastructure or making accusations about a property based on a visible pipe. A careful report identifies the location and observable issue while leaving technical diagnosis to qualified personnel. That division of roles protects the usefulness of the observation and avoids turning uncertainty into an unsupported allegation.
Maintenance is part of the investment
EPA’s operation-and-maintenance guidance stresses that green infrastructure needs care throughout its life and recommends clear responsibility, schedules and inspection arrangements. That principle turns a grant announcement into a long-term question. An installation may be paid for through a particular award, while future care needs its own arrangements. Do not assume that the person who builds a practice will maintain it indefinitely or that a volunteer group has accepted every task. A public plan should identify who owns each responsibility and how problems move from observation to action.
An original maintenance register could separate routine care from corrective work. Routine care might be scheduled and documented, while a damaged component could require a separate decision, budget or contractor. The register would include the site, the issue, the responsible party and the next review date. This is a reporting concept, not a substitute for the technical maintenance plan. Its benefit is showing whether an issue has an owner. A record that says only “maintenance needed” leaves the public unable to tell whether anyone is expected to respond.
Maintenance also makes continuity visible. Suppose a fictional project is transferred from a contractor to a municipal department. The handoff should include the information the new custodian needs, not merely a completion photograph. A resident can ask whether the organization has accepted the asset and where future service reports belong. The question does not imply that a handoff has gone wrong. It recognizes that responsibility can change over the life of infrastructure. Following that change helps prevent a successful installation from becoming an unmanaged feature after the grant period ends.
A useful project timeline has distinct milestones
Grant award, design, permissions, procurement, construction, establishment and monitoring can occupy different parts of a project’s life. This is a general way to organize the process, not a statement that every Chesapeake award follows the same sequence or requires the same approvals. The public update should explain the sequence that actually applies. A delay at one stage may affect later milestones without meaning that nothing has been done. Conversely, completing an early stage does not justify describing every later stage as complete.
A hypothetical timeline might show design finished in spring, installation expected in autumn and the first scheduled performance review the following year. If the installation shifts, the update should identify the new expectation and the reason that can be shared publicly. A calendar should distinguish a target from a commitment and an anticipated review from a completed one. Those labels reduce confusion for residents who are trying to decide when to look for visible work. They also make it easier to assess an update fairly against the project’s stated plan.
Useful timelines are specific enough to follow without pretending that uncertainty has disappeared. “Work will happen eventually” offers no practical reference. “Work will be finished on this exact day” can overstate confidence if several dependencies remain unresolved. A better statement names the current stage, the next milestone and the conditions that could change it. Residents can then ask a focused follow-up when the milestone passes. This turns oversight into a sequence of concrete questions rather than a general debate about whether a project feels fast or slow.
Baselines make later comparisons meaningful
A baseline describes the starting reference against which later observations are compared. Without one, a report may show that a condition exists but struggle to show that it changed. For a project reader, ask what information was collected before implementation and whether the same type of information will be collected later. A baseline can include different variables depending on the project’s purpose. This article does not prescribe a universal sampling protocol. It explains why the starting reference should match the claim the project eventually intends to make.
In a fictional example, a team records inlet condition before construction and again afterward. That comparison may support a statement about visible inlet condition. It cannot automatically support a statement about annual nitrogen reduction unless the project has evidence appropriate to that additional claim. The broader the conclusion, the more the supporting information must cover. A resident can use this principle to read a dashboard critically without dismissing useful limited evidence. The right response is to identify what the comparison shows, then ask what additional evidence would be needed for a larger conclusion.
Baselines should also be documented clearly enough that a later team can understand them. Dates, locations, methods and relevant conditions help preserve meaning. An unlabeled spreadsheet can contain many numbers and still fail as a public explanation. If a project changes its method, it should explain how that affects comparison with earlier records. A methodological change may be justified, but treating unlike measurements as directly interchangeable can create a false trend. Continuity in documentation is therefore part of accountability, especially when a project lasts longer than one staff member’s involvement.
Concentration and load answer different questions
Concentration describes an amount relative to a volume; a load describes an amount transported over a defined period. A purely hypothetical container example makes the distinction concrete. If one liter contains two milligrams of a substance, the concentration is two milligrams per liter. Ten liters at that same concentration contain 20 milligrams in total. The example is arithmetic, not a representation of an actual stream or grant outcome. It shows why the amount of water matters when translating a concentration into an overall transported quantity.
Now imagine two invented periods with identical concentrations but different water volumes. The period with twice the volume transports twice the amount under the simplified assumptions. Conversely, a lower concentration does not necessarily mean a lower total amount if the volume rises enough. A resident reading an update should therefore ask whether the reported improvement concerns concentration, estimated load or another measure. Those labels should not be collapsed into a single word such as “pollution.” Each can be useful, but they illuminate different parts of the water-quality question.
Real watersheds require more complex assessment than a container calculation. Flow varies, sampling has limitations and several pathways may contribute material. The elementary example is useful precisely because it isolates one relationship. It does not authorize anyone to calculate a project’s annual reduction from a single photograph or one isolated reading. When a public report gives a load estimate, look for its time period, method and assumptions. A transparent estimate can inform decisions, while an unlabeled number leaves readers unable to tell what was actually compared.
Weather is context, not an excuse to ignore results
The Chesapeake Bay Program’s clean-water information explains that hydrologic conditions strongly influence annual nutrient and sediment loads. That means rainfall and flow belong in interpretation, rather than being treated as irrelevant background. A project update can acknowledge those influences while still reporting its own delivery and monitoring honestly. Context should help explain a result; it should not become an all-purpose excuse that prevents scrutiny. Residents can ask what the observed period was like and how the analysts distinguish project performance from differences in conditions between comparison periods.
Consider an invented situation in which a new installation is observed only during a dry month. The absence of visible runoff during that month says little about how the installation handles water during a storm. A separate observation after rain may reveal a different aspect of its function. Neither view is automatically wrong. They need to be labeled for the question they answer. A public report that combines them thoughtfully is more useful than one that chooses whichever picture looks most favorable and leaves the conditions unstated.
Do not demand that every short-term observation reveal a regional trend. A local project can be inspected on its own timeline while broader water-quality patterns are evaluated through wider monitoring. The scales can inform each other without being identical. If a report claims a bay-wide effect from one small intervention, ask how that attribution was established. If it claims only that a local practice was installed and functioning as intended during an inspection, evaluate that narrower claim on its evidence. Fair accountability requires matching the size of the conclusion to the size of the observation.
Models and measurements play different roles
A modeled benefit estimates what may follow under a specified set of relationships and assumptions. A measurement records an observed variable using a particular method. They can complement each other, but one should not be relabeled as the other. For the newly announced grants, a planned reduction may help justify the selected practice before direct results are available. Later monitoring can test relevant aspects of performance. This distinction is general analytical guidance; the article does not claim to have reviewed or validated the model used by an individual 2026 award.
A hypothetical grant summary might project a reduction of 1,000 units per year. An implementation report could later confirm that the planned practice was installed, but that confirmation alone would not convert the projected 1,000 into a measured result. The project might apply an approved accounting method to estimate a benefit, which should still be described as an estimate. A reader should ask how the number was produced and whether its uncertainty is communicated. Precise-looking figures can be useful, but their appearance does not eliminate the assumptions behind them.
The same care applies to comparison charts. A bar labeled “before” and a bar labeled “after” may combine measured data, estimates or projections unless the legend specifies the source. Ask whether the bars use the same unit, period and method. If not, the visual comparison needs explanation. An honest chart can show different types of information side by side, provided it makes the distinction visible. A misleading chart lets the format imply a stronger conclusion than the underlying evidence supports. Reading the legend is therefore part of reading the result.
Community participation needs a defined role
An organization can invite residents into planning, monitoring education or approved volunteer activities, but the role should be clear. Ask what participants will do, what training is provided and who will supervise the work. This guide does not claim that a particular award offers a specific volunteer opportunity today. It offers a way to assess an invitation when one is published. A resident should not have to guess whether an activity is a consultation, a maintenance task or an educational demonstration, because those activities involve different responsibilities and expectations.
A fictional community meeting illustrates the difference between attendance and influence. Twenty people might attend, yet the meeting record could fail to show which questions were raised or how the team responded. A stronger record identifies the issues, the decisions they informed and the items still unresolved, without exposing private information unnecessarily. Attendance can demonstrate that an event occurred. It cannot by itself prove that community concerns shaped a design. Public updates should describe participation in a way that makes its practical connection to the project visible.
Accessibility matters in the information process as well as at a physical site. A useful project summary should be understandable without specialist vocabulary and available in a form residents can use. Technical documents remain important, but they should be accompanied by clear explanations of the local purpose and next steps. A community may need multiple communication formats rather than one dense PDF. The article does not establish what any specific grantee currently provides. It identifies an ordinary test of public usefulness: can the people affected find and understand the information they need?
Follow a site without entering a work area
A resident can document a project from an authorized public location and keep observations narrow. Record the date, the viewpoint and what is visibly present. A sign, a planting area or active construction can show a milestone, but none automatically reveals a hidden technical condition. Do not enter restricted land, approach machinery or disturb an installation to obtain a better photograph. The useful observation is one the responsible team can interpret, not one created by interfering with the work. Follow site instructions and use the designated contact for concerns.
A hypothetical observation note might say that debris is visible at a named public inlet on a particular date. That is more useful than saying the entire restoration project has failed. The first statement identifies something that can be checked; the second leaps from an observation to a broad conclusion. Add a photograph if appropriate and explain the location clearly. Leave the assessment of cause and remedy to the responsible organization. If the organization later confirms the issue and action taken, the public record can connect the initial observation with the response.
Observations over time can be valuable when they remain consistent. Use the same safe viewpoint if it is still available and keep the date visible in your notes. If weather or access changes, record that too. This is a personal documentation method, not a scientific sampling program. It can help a resident ask better questions and follow visible milestones. It should not be presented as a replacement for professional monitoring or used to publish unsupported claims about water safety, regulatory compliance or a landowner’s responsibility.
A compact accountability file can keep the story organized
Create a file with the official project title, grantee, named waterway, award source and announced purpose. Add the original announcement date separately from the date you collected the document. That distinction prevents an old announcement from looking like a new one when it is shared again. Then keep later updates in chronological order. A small, orderly file can reveal whether a promised milestone has been addressed and whether a number changed because the project changed or because the reporting category changed. More documents are useful only when their relationship is clear.
For each update, write one sentence describing what is new. Examples might include a completed design, a revised location, an installation milestone or a published monitoring result. These are possible categories, not claims about current award progress. If the update repeats an earlier announcement, label it as repetition rather than invent a new development. The method keeps attention on substantive changes. It also makes a future summary easier to write without accidentally merging a planned action from one date with a completed action reported at another.
Keep a short list of unresolved questions rather than a long catalog of suspicions. A question such as “Who maintains this installation after the grant period?” has a concrete answer or an identifiable gap. A broad accusation that nobody is accountable may be harder to evaluate and may not be supported. When an answer arrives, record its source and scope. If it applies to one site, do not extend it to every project in the watershed. Precise follow-up respects both the public’s interest and the limits of the available evidence.
What the next Chesapeake update should make clear
For the October grants, the next useful information will concern delivery: locations, schedules, responsible teams and progress against the stated activities. Later updates can address performance through appropriate measurements and estimates. The two stages should remain connected without being collapsed. Residents near a project can follow the local work, while regional readers can examine how the portfolio is reported. Neither audience benefits from counting the announcement itself as proof of cleaner water. The award is a real development; its intended environmental results are the work still to be demonstrated.
The Cumberland and Watts Branch examples show why the public story should remain local enough to follow. A streamside buffer, a runoff treatment area and a corrected connection have specific purposes that can be described clearly. Funding totals explain the resources available, while project records explain what those resources do. A credible restoration narrative moves between those scales carefully. It does not exaggerate an isolated observation into a watershed-wide verdict, and it does not hide a local problem behind a large regional number.
The practical opportunity is to use the announcement as the beginning of an informed relationship with a nearby waterway. Learn the project’s name, understand its proposed pathway and watch the next documented milestone. Ask for methods when results are reported and for responsibility when maintenance is discussed. Those habits do not require invented optimism or automatic skepticism. They create a fair standard: describe what was planned, what was done, what was observed and what remains uncertain. That standard makes a long restoration effort understandable without pretending it is already finished.
Sources and editorial note
Sources checked October 4, 2026: EPA October 2 funding announcement, NFWF 2026 grant slate, EPA nutrient pollution overview, USGS turbidity explanation, EPA dissolved oxygen guidance, EPA green infrastructure types, EPA operation and maintenance, Chesapeake Bay Program clean water. This is an expansion of the original October 3 article, not a new announcement or a claim of completed project results. Grant descriptions remain plans. Budget arithmetic, observation files, dashboards and other examples are explicitly hypothetical editorial explanations. Background resources explain mechanisms and interpretation; no project-specific scientific assessment, engineering certification or water-safety finding is offered.