


How to Read a Weather Radar Image: Reflectivity, Motion, and Its Limits
Weather Guide
How to Read a Weather Radar Image: Reflectivity, Motion, and Its Limits
A weather-radar map is a picture of radio energy returned from a sampled volume of the atmosphere at a particular time. It is not a camera aimed at the ground, and a loop is not a forecast. Three questions help: what is reflecting energy, what part of its motion is the radar measuring, and how well does the sample represent conditions where you are?
Reflectivity: echo strength, not a rain gauge
A Doppler radar sends out brief pulses and listens for energy scattered back by targets. Reflectivity describes the returned power. Products usually express it on a logarithmic scale called dBZ: on the map, stronger returns generally appear as more intense colors, but the color key differs by product and provider. Check the legend rather than assuming a particular color always means the same thing.
Higher reflectivity often accompanies heavier precipitation, but it does not directly measure rainfall at the surface. The return depends strongly on the size, number, shape, and type of particles in the radar sample. Large drops, hail, snow, and even birds or insects can produce echoes; similar dBZ values can correspond to different rain rates. NOAA’s dBZ-to-rain-rate figures are approximate hourly rates, not the amount a location will receive. Accumulation also depends on how intensity changes and how long precipitation stays over an area.

The common base reflectivity product uses the lowest radar elevation scan. Composite reflectivity combines the strongest return from multiple elevation scans. Composite can reveal stronger echoes aloft that the lowest scan misses, but the two products may have different timestamps. Neither tells you by itself exactly what is reaching the ground.
Motion: toward or away from the radar
A velocity image uses the Doppler shift in returning pulses to estimate the component of target motion along the line from the radar to the target, called radial velocity. It is not a full map of wind direction or the target’s true speed. Motion directly toward or away from the radar is sampled best; motion across the radar beam can show little or no radial velocity even when it is fast.

On many NWS displays, green indicates motion toward the radar and red indicates motion away. Always read that product’s legend: color conventions can vary. Adjacent inbound and outbound colors can signal rotation in a storm, but radar detects a circulation at the sampled height, not a tornado touching the ground. Forecasters use multiple scans and other evidence to assess a threat.
A loop strings together recent scans. It can help show where echoes have moved, but it does not extend that motion into the future or account for a storm changing, forming, or weakening. Check frame times and product timestamps; radar data take time to collect, process, and display.
Why an echo may not match what you see outside
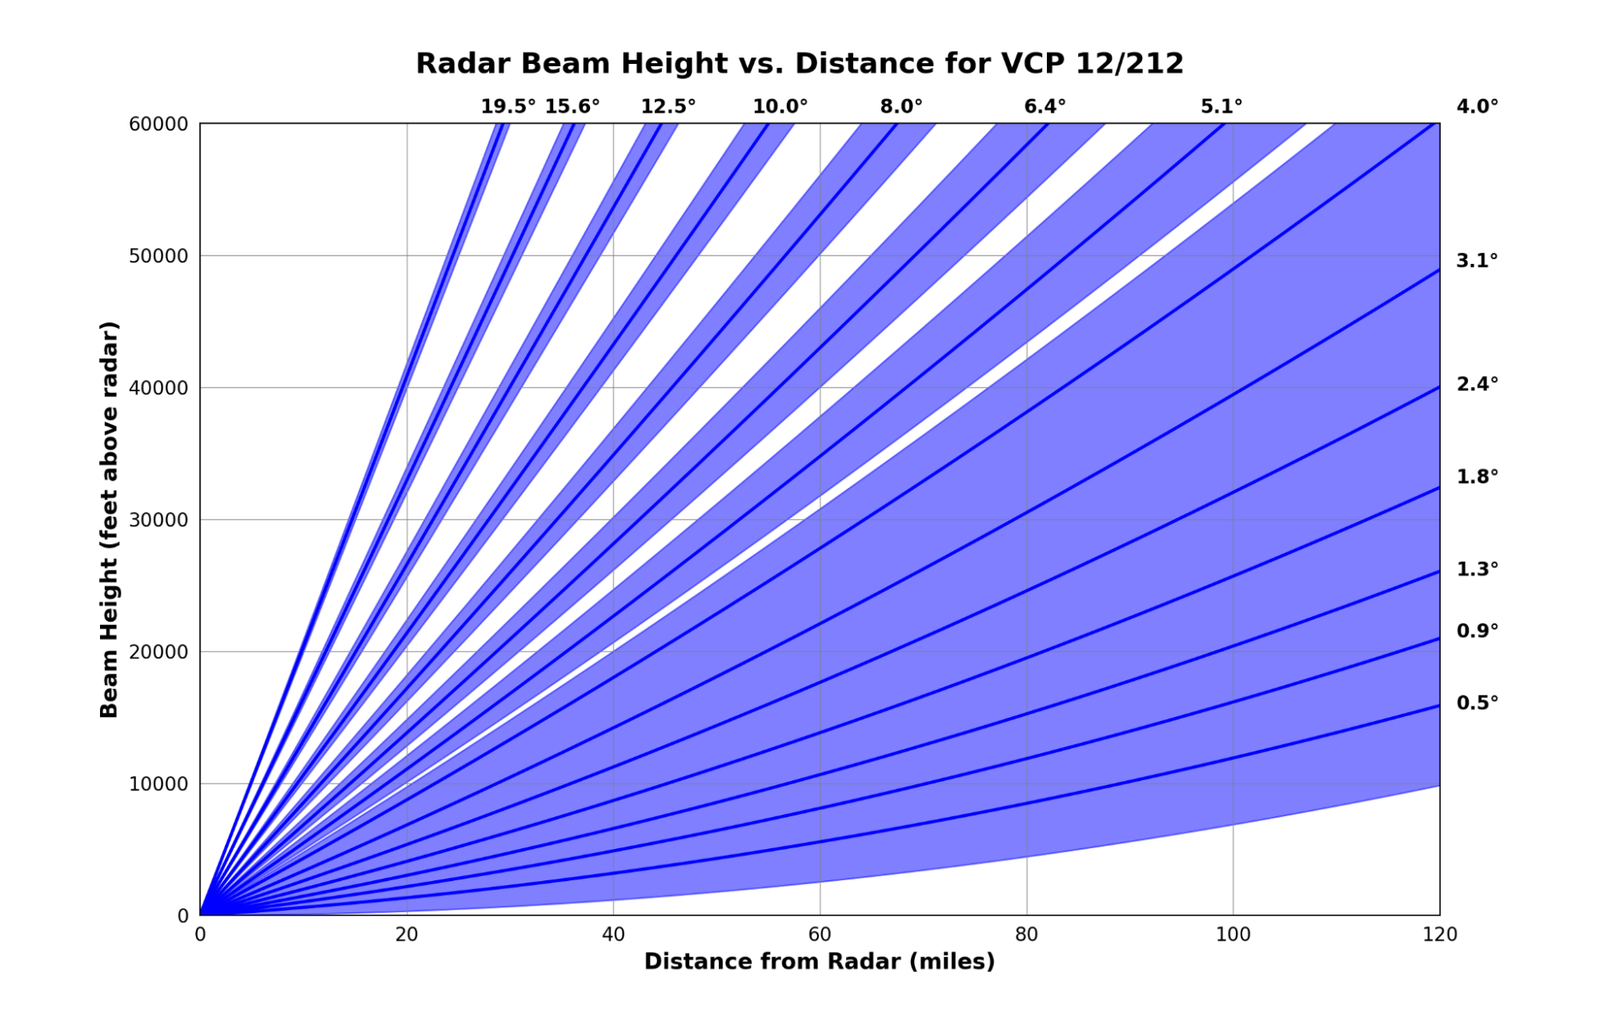
Radar beams spread out and rise above the Earth’s surface with distance. NOAA notes that the lowest WSR-88D scan is roughly 12,000 feet above ground at 100 miles from the radar. Far away, a radar may sample only the upper part of a storm, miss shallow precipitation, or smooth out small features. Nearby hills, mountains, buildings, or other obstructions can partially block a beam, leaving weak or missing returns beyond them.
Precipitation aloft may also evaporate before reaching the ground, a phenomenon called virga. Conversely, rain can be falling where a radar image looks weak because the beam samples too high, the echo is attenuated or blocked, or the precipitation’s particle sizes return less energy. A bright echo is not a precise surface-rain measurement, and a blank patch is not proof of clear or safe conditions.
Not every echo is weather. Ground clutter, birds, insects, wind turbines, or unusual atmospheric bending of the beam can create non-precipitation returns. Anomalous propagation can look convincing. Compare nearby radar sites, radar products, surface observations, and the official forecast instead of drawing a conclusion from a single image.
Use radar as context, not a safety guarantee
Radar is valuable situational awareness, but it has blind spots and describes sampled conditions, not a promise about what is happening at the ground or what will happen next. For decisions, check current National Weather Service watches, warnings, advisories, and local forecasts, and follow the instructions in an official warning. A radar loop should never override a warning or serve as an all-clear.
Official references
- NOAA JetStream, Radar Images: Reflectivity
- NOAA JetStream, Radar Images: Velocity
- NOAA JetStream, Radar Beams
- NOAA JetStream, How Radar Works
- NOAA JetStream, Anomalous Propagation
- National Weather Service, Virga explained graphically
- National Weather Service, Current alerts
By OnelROR Editorial Team. October 23, 2026. 4-minute read.