


One Earthquake, Many Experiences: Magnitude and Intensity Explained
Science & Space
One Earthquake, Many Experiences: Magnitude and Intensity Explained
The headline number describes an earthquake’s size. Local shaking tells a different part of the story—and the distinction changes how you read a map.
By OnelROR Editorial Team · October 11, 2026 · Miami · 4 min read
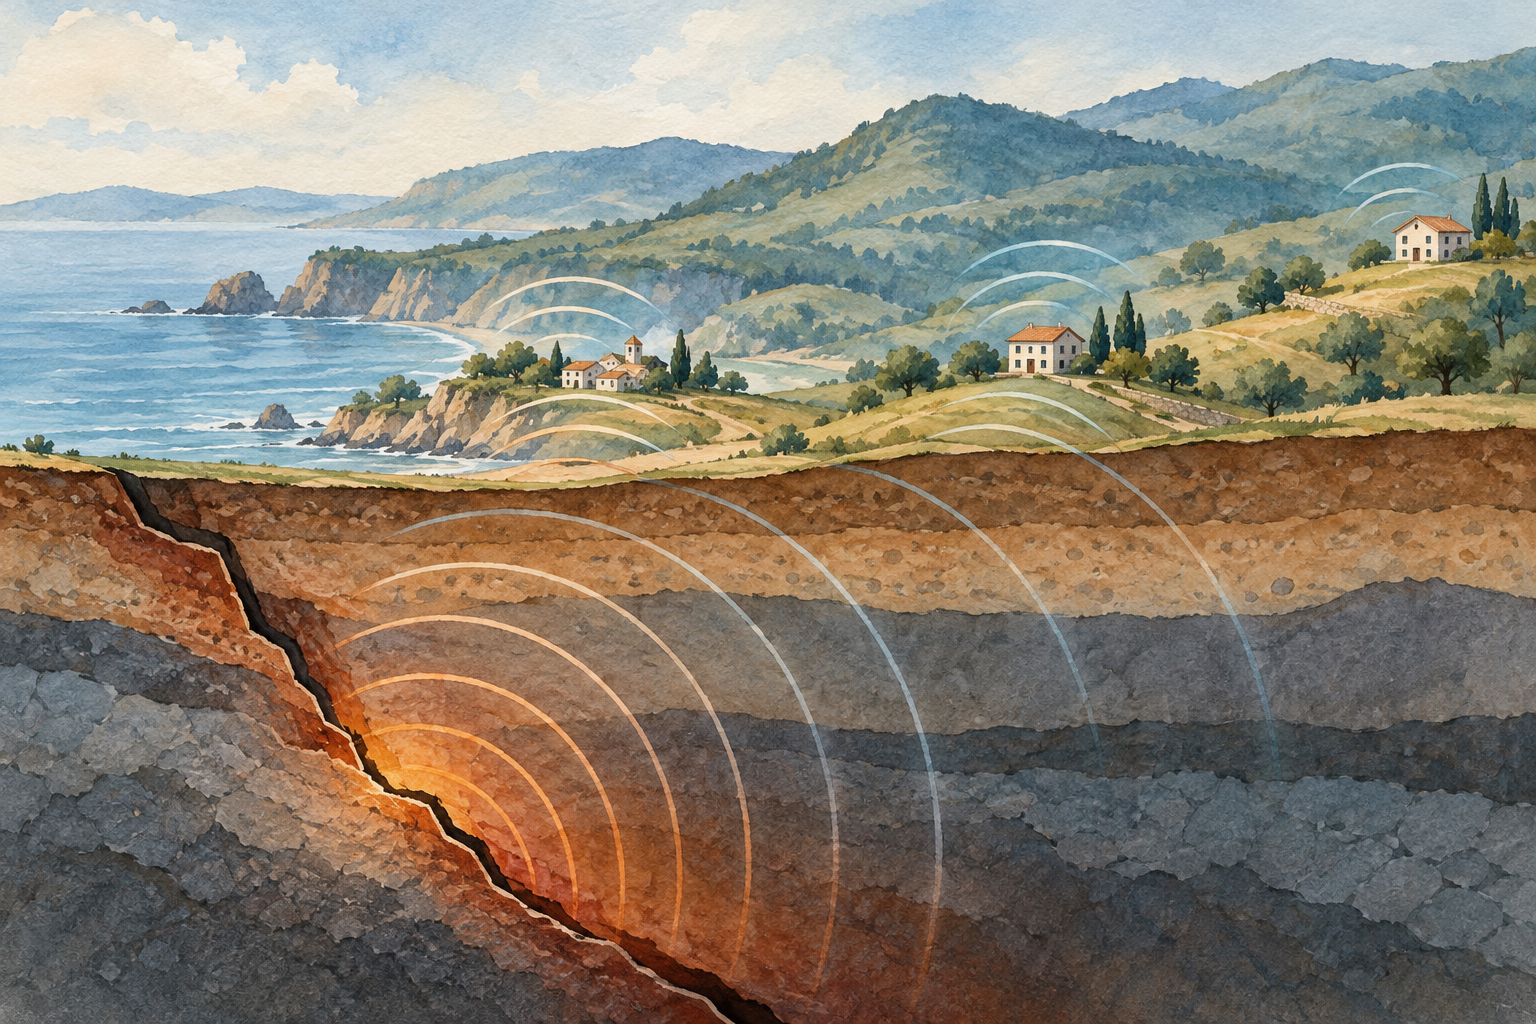
Cover: AI-generated conceptual illustration by OnelROR Editorial Team. The landscape and vibration arcs are illustrative, not a real event, measured shaking or a simulation.
Start with the question the number answers
Two people can describe the same earthquake very differently. One notices a slight movement; another sees objects fall. That difference does not require two earthquakes or a mistake in the headline magnitude. It requires asking what each observation measures. Magnitude describes the size of the earthquake at its source. Intensity describes the shaking and its effects at a particular place. A single event can therefore produce a range of local intensities.
This explanation draws on British Geological Survey guidance, IRIS educational material and the USGS ShakeMap manual cited as Worden and colleagues (2020), alongside its current software guide. It describes established methods, not a new earthquake. The 2020 citation dates the manual, not an event. Our illustrations are conceptual and contain no measured earthquake data.
Magnitude comes from measurements, not a witness’s impression
A seismometer measures ground motion at its location. Its recorded trace is a seismogram. Scientists use recordings from stations to estimate an earthquake’s location and size. The British Geological Survey explains that different magnitude methods examine different parts of those signals and apply appropriate corrections. A larger trace at one station is not, by itself, a complete earthquake-size calculation: the measurement needs its method and context.
The familiar Richter name refers to a local magnitude scale. Moment magnitude, written Mw, instead relates to seismic moment: the rigidity of the rocks, the area of fault that moved and how far it slipped. IRIS explains that this physical description can be derived from seismograms. Do not silently rename every published magnitude the Richter scale. Read the magnitude type when it is supplied; those small letters tell you which estimate you are looking at.
Magnitude scales are logarithmic. On an amplitude-based scale, a whole-number step represents a factor of ten in the corrected recorded amplitude. That statement does not mean every building shakes ten times harder or every person feels ten times as much. The source-size comparison and a location’s actual motion answer different questions. Keeping those questions separate is more useful than treating magnitude as a universal damage score.

Intensity belongs to a place
Distance from the source is only part of the picture. BGS explains that soft sediments can amplify vibrations, while harder rock can limit shaking; building characteristics also affect the consequences. Two places at similar distances can therefore have different experiences. Do not infer a neighborhood’s geology or a building’s condition from one report. Those questions need evidence beyond the headline magnitude.
Intensity scales describe effects on people, objects and structures. The USGS uses Modified Mercalli intensity, commonly shown with Roman numerals; the British Geological Survey uses the European Macroseismic Scale in the UK. A reader should identify the scale before comparing descriptions from different services. Reports of felt effects and measurements of ground motion can both contribute to estimates of intensity. They remain information about a location, rather than another magnitude for the earthquake.
A shaking map brings the differences into view
ShakeMap’s official documentation describes a combination of ground-motion models, instrumental recordings and ‘Did You Feel It?’ reports. Its 2020 manual explains that estimates fill areas where observations are sparse or absent. This makes the map useful, but also makes its interpretation important: an area of color is not an instrument at every point. A map of shaking includes both observations and estimates.
Before interpreting a color, read the legend and the product name. Does the map display intensity, acceleration or something else? Where do its observations come from? What time or version does it represent? Those questions help you avoid comparing unlike quantities. A point marking an epicenter identifies a location; it does not tell you, on its own, what every town experienced. Preserve the legend when sharing a map so the colors keep their meaning.

Read an early estimate as an estimate
The British Geological Survey notes that reported magnitudes can change as more data are analyzed. A revision is not a second earthquake, and it is not automatically evidence that a service is unreliable. When comparing reports, check whether they concern the same event, which magnitude type they use and when each estimate was issued. Keep an event’s occurrence time separate from the time of an update. A screenshot without those details can make an ordinary revision look like a contradiction.
A practical reading sequence is to identify the event, note its magnitude type, and then look for local shaking information with its legend and update time. Use those records for what they establish. Neither a headline number nor a generalized map is an inspection of your building. The science becomes clearer when the source and the local experience remain connected without being collapsed into the same measurement.